NOTE: You can now take course by the author with video and example traces on Wireshark. Check this post for more details.
Author’s Note: This is the second part in a six-part series about finding and solving many networking anomalies using the Wireshark network protocol analyzer. If you are new to the series, you can find part 1 here, and the whole series here.
TCP Retransmissions in traces are a very common problem. And while TCP retransmissions generally are not considered a good sign, they are not always a bad sign, nor are they always the cause of a given problem. For example, retransmissions in traces are very common when using a single NIC hardware load balancer. This is due to the load balancer modifying only the Ethernet header (replacing the source and destination MAC addresses to send the new frame to the designated node of the load balanced set). If the network trace is taken from a spanned switch port to capture all the data on the subnet, you will see traffic similar to the following:
No. Source Destination Protocol Info 1 160.207.151.107 160.207.12.41 HTTP GET Frame 1 (815 bytes on wire, 815 bytes captured) Ethernet II, Src: Cisco_2e:17:4a (00:0d:66:2e:17:4a), Dst: 160.207.12.40 (00:e0:81:62:70:e4) Destination: 160.207.12.40 (00:e0:81:62:70:e4) Source: Cisco_2e:17:4a (00:0d:66:2e:17:4a) Type: IP (0x0800) Internet Protocol, Src: 160.207.151.107 (160.207.151.107), Dst: 160.207.12.41 (160.207.12.41) Version: 4 Header length: 20 bytes Differentiated Services Field: 0x00 (DSCP 0x00: Default; ECN: 0x00) Total Length: 801 Identification:0x8303 (33539)Flags: 0x04 (Don't Fragment) Fragment offset: 0 Time to live: 127 Protocol: TCP (0x06) Header checksum: 0x90a0 [correct] Source: 160.207.151.107 (160.207.151.107) Destination: 160.207.12.41 (160.207.12.41) Transmission Control Protocol, Src Port: 1268 (1268), Dst Port: http (80), Seq: 0, Ack: 0, Len: 761 Hypertext Transfer Protocol No. Source Destination Protocol Info 2 160.207.151.107 160.207.12.41 HTTP GET Frame 2 (815 bytes on wire, 815 bytes captured) Ethernet II, Src: 160.207.12.40 (00:e0:81:62:70:e4), Dst: 160.207.12.19 (00:11:43:fe:0b:18) Destination: 160.207.12.19 (00:11:43:fe:0b:18) Source: 160.207.12.40 (00:e0:81:62:70:e4) Type: IP (0x0800) Internet Protocol, Src: 160.207.151.107 (160.207.151.107), Dst: 160.207.12.41 (160.207.12.41) Version: 4 Header length: 20 bytes Differentiated Services Field: 0x00 (DSCP 0x00: Default; ECN: 0x00) Total Length: 801 Identification: 0x8303 (33539) Flags: 0x04 (Don't Fragment) Fragment offset: 0 Time to live: 127 Protocol: TCP (0x06) Header checksum: 0x90a0 [correct] Source: 160.207.151.107 (160.207.151.107) Destination: 160.207.12.41 (160.207.12.41) Transmission Control Protocol, Src Port: 1268 (1268), Dst Port: http (80), Seq: 0, Ack: 0, Len: 761 Hypertext Transfer Protocol
By examining these two frames closely at both Layer 2 (Ethernet) and Layer 3 (IP), we can easily see that the frames differ in the source and destination MAC address fields. This is indicative of a load balancer, in this case at the 160.207.12.40 (00:e0:81:62:70:e4) address, directing traffic to the load balanced pool.
More importantly for future TCP retransmission analysis, we can see by looking at the IP header that the Identification field (0x8303) does not change in these two packets. This is important, as according to Standard 5, the originating protocol module must set this field to a unique value for each datagram sent to a given source-destination pair for a given protocol. Since the protocol, source, and destination are identical at the IP level in these two packets, for it to be a real retransmission, the second packet must have a different value in the Identification field.
These two features show us that in this particular example, the TCP retransmission is not a true retransmission, but rather a side effect of a valid load balancing process. However, this is a fairly cut and dry example. There are many other examples where the TCP retransmissions are real, but still don’t necessarily have anything to do with the core problem. For this reason, I like to ask a few questions to filter down the information:
- Are the retransmissions real retransmissions, as shown by the IP Identification field changing?
- Are the retransmissions statistically significant, for either the entire capture, or for any given remote host?
The first question we saw how to answer earlier, but answering the second question is a bit more complex. First, let’s decide on what we need to consider ‘statistically significant’. In general, I usually become concerned with anything approaching 10%, though this is mostly a matter of opinion. Once you have decided what number you are going to consider significant, you need to do some statistical analysis. For this, we will make use of some of Wireshark’s filtering and statistics features.
First, we want to determine the percentage of retransmissions to the total capture. To do this, enter in the following filter in Wireshark:
Tcp.analysis.retransmission
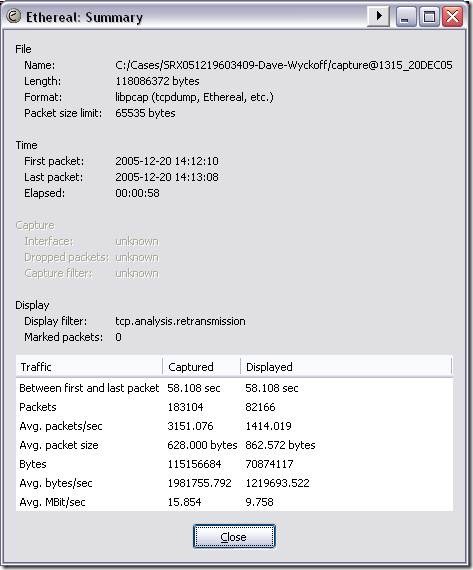
Once applied, this filter will show only retransmissions. Next, click on the Statistics menu and choose Summary (the first menu item). This will show you some statistics on both the total and displayed frames, like so:
In the captured column, you can see that 183,104 packets are in the total capture. In the displayed column, you can see that 82,166 packets remain after applying the tcp.analysis.retransmission filter to the capture. This means that approximately 45% of the frames in this capture are retransmissions, which is definitely cause for concern. However, keep in mind that this is an unusual case. In most scenarios, the number of retransmissions will be closer to 2 or 3%, which is not at all bothersome. Even in these cases, however, you will sometimes find cause for concern. For example, while the total number of retransmissions may not be worrisome, the number of retransmissions to a single system or subnet may be grossly excessive.
If you have a small number of frames in the trace, you can easily look for trends by leaving the retransmission filter applied and sorting in the main window based on destination address by simply clicking the ‘destination’ heading. However, with large captures like in our previous example, a faster technique is to use the ‘Destinations’ function under the Statistics menu. This function allows you to see the total number of frames to each destination, and is able to utilize a filter to generate its data. When you click the destinations menu item, a dialog will open for you to enter your filter in:
Once you enter the filter, click the ‘create stat’ button, and Wireshark will generate statistics about the destinations for frames matching the filter, like so:
This feature makes it very easy to see where we may have problems communicating with a specific host.
Now that we know how to answer both of the questions we asked earlier, we need to determine if the answer to both is ‘Yes’. Just for clarity, here are the questions:
- Are the retransmissions real retransmissions, as shown by the IP Identification field changing?
- Are the retransmissions statistically significant, for either the entire capture, or for any given remote host?
If the answer to both of these questions is ‘Yes’, then we should ask one more question: Could the retransmissions we are seeing be causing or contributing to the core problem we are troubleshooting? If the answer to this question is also ‘Yes’, then we need to work on determining why the retransmissions are occurring.
At the most basic level, retransmissions occur for one reason: An ACK was not heard for the frame in question in what the operating system considers a reasonable amount of time based on the SRTT (Smooth Round Trip Time) observed during the session. This process may speed up slightly when using fast retransmissions, but the core reason remains the same.
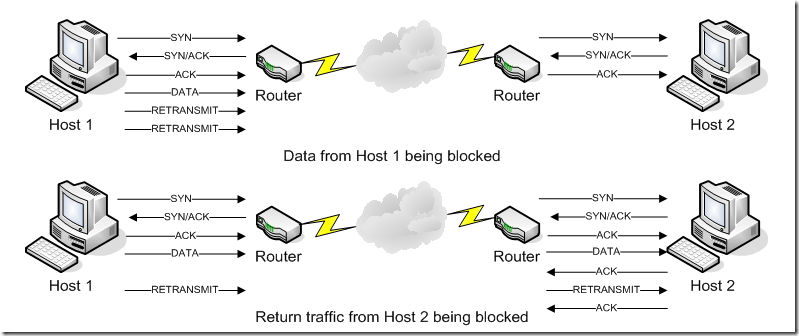
So now that we know the basic reason for seeing the retransmissions, we now need to know where in the path we are experiencing the loss. We can most easily determine this by taking simultaneous traces while trying to communicate with the problem system. By matching up packets in both traces using sequence numbers, we should see either data from the sending host being blocked (because it will be missing from the receiver’s trace), or the acknowledgement (possibly also containing data) from the receiver being blocked. Examples of the data flow for both of these are shown in diagrams below:

Unfortunately, with the exception of the simplest networks, this still doesn’t tell us specifically where the traffic is being blocked or dropped, but it does tell us what specifically is happening, which helps us direct the client to the source. Finally, if we are unable to resolve the issue because it is not on a system under our control, the information from the traces helps us prove to the client that the source of the problem is outside of our control.


![clip_image002[8] clip_image002[8]](http://lh6.ggpht.com/-C-bzttTY-gM/T71yC3uZjOI/AAAAAAAAEak/pDISB0Y8HHw/clip_image002%25255B8%25255D_thumb%25255B1%25255D.jpg?imgmax=800)
![clip_image002[10] clip_image002[10]](http://lh3.ggpht.com/-jLAA7UhhgaI/T71yD1JmspI/AAAAAAAAEa0/1fSVVm20ipk/clip_image002%25255B10%25255D_thumb%25255B1%25255D.jpg?imgmax=800)


#1 by Syed Waseem on April 10, 2013 - 4:55 pm
Really a good documentation for troubleshooting purpose. Highly appreciate this
Thanks Brian.
#2 by Tico88 on March 11, 2017 - 2:58 pm
Good Info, thanks.